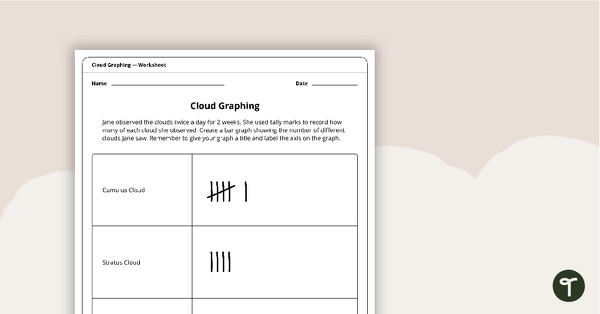
Guide your students to collect data, make tally marks, create a bar graph and analyze data with this math activity designed for 1st and 2nd-grade students.
Graphs for Kids
Graphing is a concept that students learn about from an early age. They learn how to read basic graphs such as pictographs and bar graphs and answer questions about them. If you are looking for a fun activity for your first-grade students to use, you have come to the right place!
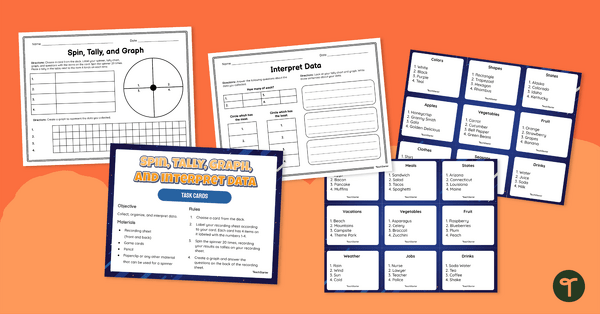
Teach Starter has created an activity that requires students to choose a category, collect data by spinning a spinner, graph the data and answer questions about the information. This teacher-created resource comes with a a double-sided worksheet that includes a spinner, places to collect data and questions to answer. Additionally, there are 36 cards that students can choose from with different categories.
How to Use Our Graphing and Tally Mark Activity
This activity is suitable for independent use, with a partner or with a small math group. When you are ready for your students to work on this activity, print out a set of task cards for the group and a worksheet for each student.
To play, students will first draw a card from the deck. After looking at their card, they will label their worksheet according to the card. Students will fill in the left-hand side of the tally chart with the 4 options from their card, the spinner, and the labels on the horizontal bar graph. Students will then spin the spinner and record tallies on their sheets. When finished, instruct students to create a horizontal bar graph based on their data.
Students can then use this data to fill in the information on the backside of their worksheet.
If you want your students to repeat this activity multiple times, consider laminating the worksheets so students write on them with dry erase markers.
Download and Print Your 1st Grade Data Activity
Are you ready to use this teacher-created resource in your classroom? Simply click on the green download button and choose between the quick-print PDF option or the editable Google Slides document. If selecting the Google Slides option, please note that you will be prompted to first make a copy of the resource to your personal Google Drive.
This resource was created by Kaylyn Chupp, a teacher in Florida and a Teach Starter Collaborator.
Additional Resources for Your Data and Graphing Unit!
Make sure to check out some of our other data analysis resources below!
teaching resource
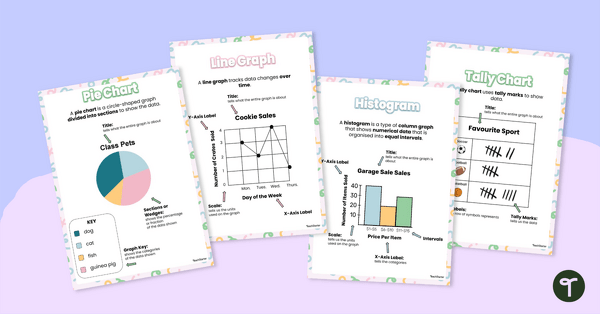
Types of Graphs Posters
This colorful and easy-to-digest visual display shows students the varying data displays they will encounter in their elementary math lessons.
teaching resource
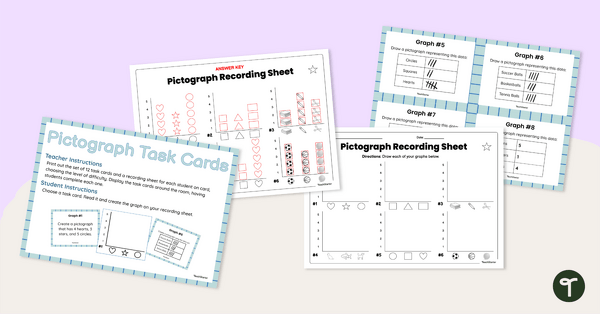
Graphing (Pictographs) Task Cards
Get graphing! Use these levelled pictograph task cards to show students a variety of data collection records, and have them create pictographs to represent that data.
teaching resource
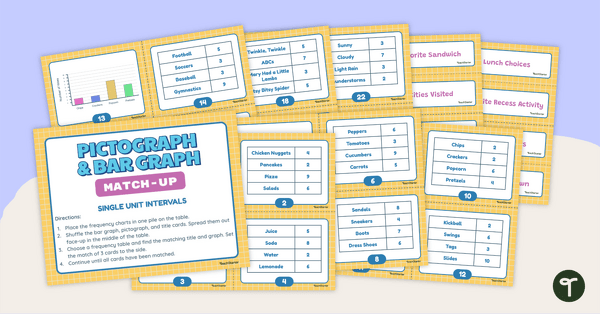
Pictograph and Bar Graph Match-Up (Single-Unit Intervals)
Use data analysis skills to match frequency tables with a corresponding bar graph or pictograph.

0 Comments
Write a review to help other teachers and parents like yourself. If you'd like to request a change to this resource, or report an error, select the corresponding tab above.